Continuation Pattern
A continuation pattern is a technical analysis formation that signals a temporary pause in the prevailing trend before the price resumes its original direction. These patterns indicate that market participants are consolidating positions rather than reversing the trend, creating a period of indecision before momentum continues. Typically forming during trending markets, continuation patterns include triangles, flags, pennants, and rectangles, each reflecting a phase of consolidation before a breakout in the direction of the existing trend. Traders use these formations to identify potential entry points, often waiting for a confirmed breakout with increased volume to validate the pattern. While continuation patterns suggest the trend will persist, false breakouts can occur, making it essential to combine them with other technical indicators for confirmation. Understanding these patterns allows traders to capitalize on trend-following opportunities, improving their ability to navigate market movements with greater precision.
Triangles
A triangle occurs when price action becomes increasingly compressed, forming converging trendlines. There are three types of triangles:
Ascending Triangle: Formed by rising swing lows and a horizontal resistance level, suggesting a bullish breakout.
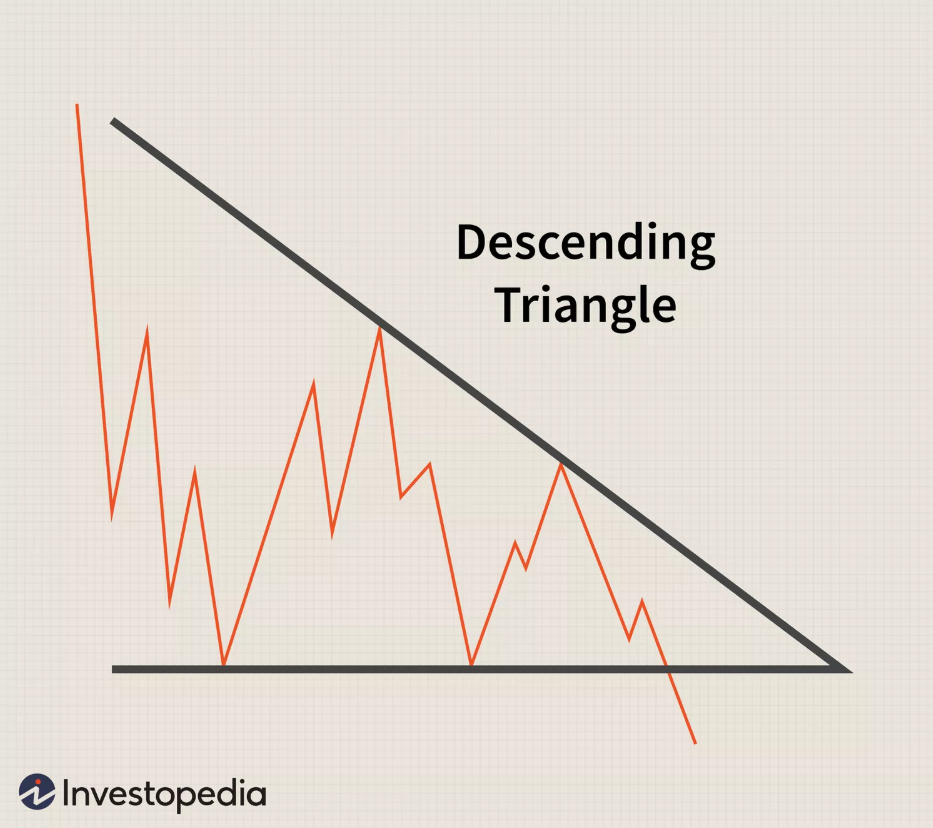
Descending Triangle: Formed by descending swing highs and a horizontal support level, often leading to a bearish breakout.
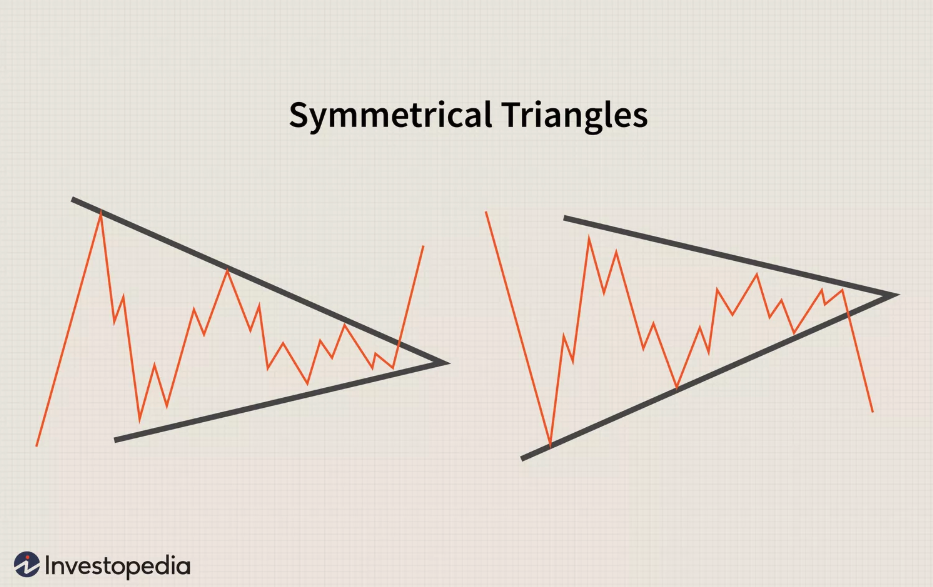
Symmetrical Triangle: Created by both lower highs and higher lows, indicating potential breakouts in either direction.
Triangles require at least two swing highs and two swing lows to form trendlines. A breakout usually occurs after multiple price touches along the converging lines.
Flags
Flags resemble pennants but move within parallel trendlines, either ascending, descending, or sideways. A flag pattern forms after a strong price movement and consists of a counter-trend consolidation, with the breakout typically occurring in the direction of the prior trend.
Pennants
Pennants are similar to triangles but much smaller, appearing as tight consolidation ranges after sharp price movements. Unlike traditional triangles, which feature clear swing highs and lows, pennants often take the form of a compact price range that narrows over time before breaking out. These formations signal a brief pause before the trend resumes.
Rectangles
Rectangles indicate a pause in price movement, where price action remains range-bound between horizontal support and resistance levels. These patterns reflect temporary equilibrium before the price eventually breaks out in the direction of the prevailing trend.
Common Types of Continuation Patterns
Continuation patterns can appear on various time frames, and the most commonly observed formations include:
Triangles (ascending, descending, symmetrical)
Flags (upward, downward, or sideways)
Pennants (small consolidation zones with converging trendlines)
Rectangles (horizontal trading ranges between support and resistance)
Each of these patterns represents a period of market consolidation before a breakout, providing traders with insights into potential price direction.
Understanding the Continuation Pattern
Continuation patterns are labeled as such because there is a higher probability that the trend will persist after the pattern completes, assuming the appropriate price action context. However, not all continuation patterns result in trend continuation. In some cases, the price may reverse direction after forming a consolidation pattern like a triangle or pennant. The reliability of a continuation pattern increases when the trend leading into it is strong, and the pattern itself is relatively small compared to the prior price wave. For example, if an asset experiences a strong upward movement, forms a compact flag or pennant, and then breaks out above the pattern, it suggests a continuation of the bullish trend.
Warning Signs of a Weak Continuation Pattern
A continuation pattern that is nearly as large as the previous trending wave may signal increased volatility, hesitation among market participants, and larger counter-trend moves—all of which reduce the pattern’s reliability. Another warning sign is a weak price move before the pattern forms. If the price inches higher, forms a continuation pattern, then inches higher again, the trend lacks strong momentum, making the setup less compelling. In contrast, a decisive price movement followed by a tight continuation pattern typically indicates strong market conviction.
Trading a Continuation Pattern
Traders employ several steps when trading continuation patterns:
Identify the Prior Trend: Determine whether the price was trending upward or downward before the pattern formed.
Recognize the Pattern: Confirm the formation of a triangle, flag, pennant, or rectangle.
Wait for the Breakout: Many traders enter positions only when the price breaks out in the direction of the prevailing trend.
Set a Stop-Loss: A stop-loss is typically placed just outside the pattern on the opposite side of the breakout to manage risk.
Setting a Price Target
Profit targets are often determined based on the height of the continuation pattern:
For rectangles and triangles: Measure the height of the pattern and project that distance from the breakout point.
For flags and pennants: Measure the price wave leading into the pattern and apply that measurement from the breakout level to estimate a target.
Risk Management and False Breakouts
A significant drawback of trading continuation patterns is the risk of false breakouts, where price moves outside the pattern but fails to follow through. To minimize this risk, traders often wait for confirmation, such as increased volume or retests of breakout levels. Additionally, patterns that form after strong price movements tend to be more reliable, while large, choppy formations may signal greater uncertainty. By incorporating volume analysis, momentum indicators, and careful risk management, traders can improve the effectiveness of continuation pattern strategies and better position themselves for potential trend-following opportunities.
Types of Continuation Patterns
Triangles
A triangle occurs when price action becomes increasingly compressed, forming converging trendlines. There are three types of triangles:
Ascending Triangle:
Formed by rising swing lows and a horizontal resistance level, suggesting a bullish breakout. An ascending triangle is a chart pattern characterized by a resistance level coupled with a series of progressively higher lows. An ascending triangle is a chart pattern that forms when a stock consistently tests a resistance area while establishing progressively higher lows. The horizontal resistance line represents the price level the stock struggles to surpass, while the ascending lows create an upward-sloping trendline. This pattern generally signals a potential bullish breakout above the resistance zone, typically occurring when the ascending trendline intersects with the resistance line. During this pattern's formation, buyers consistently encounter a resistance level they are unable to surpass, yet they gradually drive prices higher, as reflected in the series of rising lows.
Understanding the Ascending Triangle Chart Pattern
As shown in the chart above, the pattern indicates that buyers are strengthening, as evidenced by their ability to make higher lows. This consistent pressure on the resistance level signals that a breakout is imminent. However, the crucial question is, "Which way will the price move? Will the buyers succeed in breaking through the resistance, or will the level hold firm?" Many trading resources suggest that, in most cases, the buyers will eventually overpower the resistance, leading to an upward breakout. Ascending triangles typically form after a sustained uptrend, representing a period of accumulation. Although there isn’t enough bullish momentum to breach the resistance area initially, buyers continue to purchase the stock during each pullback, pushing the price higher with each successive low. As this accumulation continues, a breakout above the resistance is likely, signaling the continuation of the uptrend.Yet, experience shows that this is not always guaranteed. At times, the resistance is simply too strong, and the buyers do not have enough momentum to push past it. More often than not, the price will rise, but it's essential to remain open to the possibility of price movement in either direction. In this case, it is prudent to place an entry order just above the resistance level and below the trendline of higher lows, ensuring you're prepared for either outcome.
Components of an Ascending Triangle
Several key elements make up an ascending triangle pattern:
Preceding Uptrend
An ascending triangle usually forms after a notable uptrend. The pattern suggests that the stock is preparing to continue its upward movement, indicating the likelihood of further gains following the resistance test.Resistance Area
The resistance line is horizontal and represents a price level that the stock struggles to break above. For the pattern to be valid, this resistance must be tested multiple times. Each successive test strengthens the potential for a breakout when it eventually occurs.Ascending Lows
As the stock fluctuates between testing the resistance and setting higher lows, these lows form the ascending trendline. This trendline typically rises with each new low, showcasing growing bullish pressure.Breakout
A breakout occurs when the price moves above the resistance level, signaling the completion of the ascending triangle. The breakout should ideally happen on above-average volume. The expected price movement after the breakout is typically equal to the price difference between the resistance level and the lowest low at the beginning of the pattern.
How to Trade an Ascending Triangle
Traders can approach the ascending triangle pattern through the following steps:
Step 1: Identify the Pattern Formation
Look for a stock with a strong uptrend followed by sideways movement. A horizontal resistance line should be clearly visible on the chart, with an ascending trendline formed by the stock’s lows.Step 2: Wait for the Breakout
Ascending triangles often take weeks or months to fully form. Although multiple tests of the resistance may occur, be cautious of false breakouts. A valid breakout is typically accompanied by higher-than-average trading volume, and the likelihood of a breakout increases as the ascending trendline nears the resistance line.Step 3: Enter a Trade
Once the breakout is confirmed, enter a bullish trade. This could be done when the price breaks above the resistance level, signaling the start of the next upward move.Step 4: Exit the Trade
The potential price movement following the breakout can be estimated by measuring the height of the triangle at its widest part. This is done by calculating the difference between the resistance level and the lowest low at the start of the pattern and adding this to the resistance level to set a profit target.When setting a stop loss, position it slightly below the resistance area, which should now act as support. A small dip below the resistance level after the breakout can be normal, but a significant drop below this line may indicate that the breakout has failed.
Tips for Trading Ascending Triangles
Consider the Preceding Price Action
The formation of an ascending triangle is most reliable when it follows a strong uptrend. If the pattern develops after a prolonged period of sideways price action, it may not be as reliable.Patience is Key
Ascending triangle patterns can take time to develop, and while multiple tests of the resistance area may occur, it is essential to wait for confirmation of a breakout, preferably supported by higher trading volume. Entering prematurely can lead to trading false breakouts.The Progression of the Pattern Matters
The likelihood of a breakout increases as the ascending triangle pattern progresses. The more times the resistance level is tested without breaking, the more powerful the eventual breakout is likely to be.Always Set a Stop Loss
Even when a breakout occurs with high volume, there is still a risk of failure. A stop loss ensures protection if the breakout doesn’t follow through and the price resumes its consolidation pattern or reverses direction.
Ascending Triangle Pattern FAQs
Are ascending triangle patterns bullish or bearish?
Ascending triangles are considered bullish patterns. They typically signal a continuation of an uptrend or, in some cases, a reversal of a downtrend.What is the difference between an ascending triangle and a descending triangle?
An ascending triangle is a bullish continuation pattern that forms after an uptrend, while a descending triangle is a bearish continuation pattern that forms after a downtrend.Where should I set my profit target on an ascending triangle breakout?
The profit target is typically calculated by measuring the height of the widest part of the triangle. Add the difference between the resistance line and the lowest low at the pattern’s beginning to the resistance level to set the target.Where should I set my stop loss on an ascending triangle breakout?
It’s advisable to set the stop loss slightly below the horizontal resistance line, now acting as support. This provides room for a slight retest of the support but protects against a more significant drop that may indicate a failed breakout.


Descending Triangle:
As you may have already inferred, descending triangles are essentially the opposite of ascending triangles. A descending triangle is a chart pattern formed when a stock repeatedly tests an area of support while establishing consecutively lower highs. The lows around the support level form a horizontal line, while the progressively lower highs form a descending line. This pattern typically signals a bearish breakout below the support area, which usually happens around the point where the descending line intersects the horizontal support line. In descending triangle chart patterns, the upper trendline forms a series of lower highs, while the lower trendline serves as a support level that the price struggles to break below.
Understanding the Descending Triangle Chart Pattern
Descending triangles often form after a prolonged downtrend, indicating a phase of consolidation or accumulation. During this phase, sellers continue to push the price lower with each successive lower high, while buyers are unable to lift the price above the declining resistance. Eventually, the pressure from the declining highs and the repeated testing of support causes the price to break below the support level, leading to a continuation of the downtrend.
Components of a Descending Triangle
Several key elements make up a descending triangle pattern:
Preceding Downtrend
A descending triangle usually forms after a downtrend, signaling the potential continuation of bearish movement. This pattern is typically seen after the stock has already experienced a significant decline and is now consolidating near a support level.Support Area
The support line is horizontal and represents a price level that the stock struggles to break below. For the pattern to be valid, the support must be tested multiple times. The more times the support level is tested without being breached, the more likely it is that the eventual breakout will occur below this level.Descending Highs
As the stock fluctuates between testing the support and setting lower highs, these highs form the descending trendline. This trendline typically slopes downward with each new high, showcasing increasing bearish pressure.Breakout
A breakout occurs when the price falls below the support level, signaling the completion of the descending triangle pattern. This breakout should ideally happen on above-average volume. The expected price movement after the breakout is typically equal to the price difference between the support level and the highest high at the beginning of the pattern.
How to Trade a Descending Triangle
Traders can approach the descending triangle pattern through the following steps:
Step 1: Identify the Pattern Formation
Look for a stock that has experienced a strong downtrend and is now trading sideways, forming a clear horizontal support level and a descending trendline across the stock’s highs.Step 2: Wait for the Breakout
Descending triangles can take weeks or months to fully develop. While the stock may test the support multiple times, traders should be cautious of false breakouts. A confirmed breakout is typically accompanied by high trading volume, and the likelihood of a breakout increases as the descending trendline nears the support level.Step 3: Enter a Trade
Once the breakout is confirmed, enter a bearish trade. This is done when the price falls below the support level, signaling the beginning of the next downward move.Step 4: Exit the Trade
The expected price movement following the breakout can be estimated by measuring the height of the triangle at its widest part. This is done by calculating the difference between the support level and the highest high at the start of the pattern and subtracting this from the support level to set a profit target.When setting a stop loss, position it slightly above the support level, which is now acting as resistance. A small rise above the support line after the breakout may be typical, but a significant surge above this line signals that the breakout has failed.
Tips for Trading Descending Triangles
Consider the Preceding Price Action
The formation of a descending triangle is most reliable when it follows a strong downtrend. If the pattern develops after a prolonged period of sideways price action, it may not be as effective.Patience is Key
Descending triangle patterns can take time to develop, and while multiple tests of the support area may occur, it is crucial to wait for confirmation of a breakout. Entering too early can result in trading a false breakout.The Progression of the Pattern Matters
The likelihood of a breakout increases as the descending triangle pattern develops. The more times the support level is tested without breaking, the more significant the potential breakout is likely to be.Always Set a Stop Loss
Even when a breakout is confirmed with high volume, there is still a risk of failure. A stop loss protects you in case the price reverses, resuming the consolidation or even reversing the trend.
Descending Triangle Pattern FAQs
Are descending triangle patterns bullish or bearish?
Descending triangles are generally bearish. They typically signal a continuation of a downtrend or, in rare cases, a reversal of an uptrend.What is the difference between a descending triangle and an ascending triangle?
A descending triangle is a bearish continuation pattern that occurs after a downtrend, while an ascending triangle is a bullish continuation pattern that forms after an uptrend.Where should I set my profit target on a descending triangle breakout?
The profit target is typically calculated by measuring the height of the widest part of the triangle. Subtract the difference between the support level and the highest high at the start of the pattern from the support level to set the target.Where should I set my stop loss on a descending triangle breakout?
Set your stop loss slightly above the horizontal support line, which will now act as resistance after the breakout. This allows room for a minor retest but protects against a larger reversal if the breakout fails.
Flags
A flag occurs in technical analysis when a strong price movement, known as the flagpole, is followed by a brief consolidation phase that moves counter to the prevailing trend. There are three types of flags:
Bullish Flag:
A bullish flag is a continuation chart pattern that forms after a strong upward price movement, followed by a brief consolidation period where the price moves downward or sideways within a parallel channel. This pattern signals that buyers are temporarily pausing before continuing the uptrend. The structure of a bullish flag consists of a sharp price increase (flagpole) and a controlled pullback forming the flag. Once the price breaks above the flag’s upper boundary, it confirms the continuation of the bullish trend, often leading to another significant upward move.
Understanding the Bullish Flag Chart Pattern
Bullish flags develop as a result of market momentum. After a sharp rise in price, some traders take profits, leading to a temporary downward retracement. However, the pullback is weak, and the price consolidates within a narrow, downward-sloping or sideways channel. This consolidation phase reflects a pause in buying rather than a trend reversal. When the price breaks above the flag, it confirms the pattern and signals the continuation of the initial uptrend.
Components of a Bullish Flag
Several key elements define a bullish flag pattern:
Flagpole
The flagpole represents the initial sharp increase in price, often occurring on high volume. This move establishes strong bullish sentiment and sets the stage for the continuation pattern.Flag
The flag is the brief consolidation phase where the price moves downward or sideways in a tight, counter-trend channel. This reflects a temporary pause in buying before the next leg up.Breakout
A breakout occurs when the price decisively rises above the upper boundary of the flag. This breakout should happen on increased volume, confirming the continuation of the upward trend.
How to Trade a Bullish Flag
Traders can follow these steps to effectively trade a bullish flag pattern:
Step 1: Identify the Pattern Formation
Look for a sharp upward price movement followed by a slight downward or sideways retracement within a parallel channel. The retracement should not exceed 50% of the flagpole’s length.Step 2: Wait for the Breakout
Since a bullish flag is a continuation pattern, it is crucial to wait for a confirmed breakout above the flag’s resistance line. A strong breakout with increased volume indicates that buyers are regaining control.Step 3: Enter the Trade
Traders can enter a long position once the price breaks above the upper boundary of the flag. A common strategy is to place an entry order just above the flag’s resistance line to catch the breakout move.Step 4: Exit the Trade
The expected price movement of a bullish flag breakout is equal to the height of the flagpole added to the breakout point. This provides a reasonable target for the continuation move.Stop-loss orders should be placed slightly below the lower boundary of the flag to protect against a failed breakout. If the price moves back into the flag, it could indicate a reversal or extended consolidation.
Tips for Trading Bullish Flags
Look for Strong Volume on the Breakout
A valid bullish flag breakout should be accompanied by increased volume. Weak volume on the breakout may indicate a lack of buying pressure and increase the risk of a false breakout.Ensure the Flagpole is Steep
The strength of the initial bullish movement is critical. A strong and steep increase in price increases the probability of the pattern playing out successfully.Use Trend Confirmation
Bullish flags work best when they align with a broader uptrend. If the overall market sentiment is bullish, the pattern has a higher probability of resulting in a successful continuation.Set Realistic Profit Targets
While the target is typically based on the height of the flagpole, it’s essential to monitor price action and adjust targets if the trend shows signs of weakening.
Bullish Flag Pattern FAQs
Are bullish flags bullish or bearish?
Bullish flags are bullish continuation patterns. They indicate that the market is temporarily consolidating before resuming the uptrend.How is a bullish flag different from an ascending channel?
A bullish flag is a short-term continuation pattern that forms after a sharp price increase, while an ascending channel is a longer-term price movement where the price trends upward in a controlled fashion.Where should I set my profit target on a bullish flag breakout?
The profit target is typically set by adding the flagpole’s height to the breakout point. This provides an estimate of the expected upward price movement.Where should I set my stop loss on a bullish flag breakout?
A stop loss should be placed slightly below the lower boundary of the flag. This ensures protection against a failed breakout while allowing for normal price fluctuations before the trend resumes upward.


Symmetrical Triangle:
A symmetrical triangle is a chart pattern where the price’s highs and lows converge, forming two sloping lines that eventually meet at a point, creating the shape of a triangle. During this formation, the market experiences a sequence of lower highs and higher lows, indicating that neither the buyers nor the sellers are strong enough to drive the price in a definitive direction. If we were to view this as a battle between buyers and sellers, it would be a stalemate. This pattern also represents a phase of consolidation. A symmetrical triangle is a chart pattern formed when the price action shows a series of lower highs and higher lows, converging toward a point. The upper boundary of the triangle is drawn by connecting the lower highs, while the lower boundary is drawn by connecting the higher lows. Unlike other triangle patterns, a symmetrical triangle does not indicate a clear directional bias but suggests that the market is consolidating, and a breakout will soon occur. The breakout could be in either direction—up or down—depending on which side of the triangle the price breaks through.
Understanding the Symmetrical Triangle
Symmetrical triangles typically develop during periods of consolidation in a market that has previously experienced significant price movement. Neither the buyers nor the sellers can maintain control long enough to establish a clear trend. During the formation of the triangle, the price is caught in a battle between buyers and sellers, neither of whom is able to dominate the market fully. Sellers are pushing the price down to lower highs, while buyers are pushing it up to higher lows. The resulting pattern represents a squeeze of volatility, signaling that a breakout is imminent. This results in a series of lower highs and higher lows. As the two slopes approach each other, it signals that a breakout is imminent. While we cannot predict the direction of the breakout, we can be confident that a price move will occur, and eventually, one side of the market will prevail.
Components of a Symmetrical Triangle
There are several important components of a symmetrical triangle pattern:
Preceding Price Action
A symmetrical triangle typically forms after a period of strong price movement, whether up or down. The pattern signals a pause or consolidation in the market, and it often indicates that the market is waiting for a catalyst before deciding its next move.Converging Trendlines
The two sloping trendlines that form the triangle converge at a point, with one trendline connecting the lower highs (descending) and the other connecting the higher lows (ascending). As the price moves within these converging lines, the triangle narrows, indicating that the market is consolidating and the volatility is decreasing.Volume
As the symmetrical triangle progresses, volume typically decreases. This reduction in volume reflects the indecision in the market. Traders are hesitant, and the balance between buyers and sellers creates a temporary equilibrium.Breakout
A breakout from the symmetrical triangle occurs when the price breaks out of the converging trendlines in either direction. This breakout is usually accompanied by an increase in volume, signaling that the market has chosen a direction. The breakout can lead to a continuation of the prevailing trend or, in some cases, a reversal.
How to Trade a Symmetrical Triangle
Traders can approach the symmetrical triangle pattern in several steps:
Step 1: Identify the Pattern Formation
To spot a symmetrical triangle, look for a chart that shows a series of lower highs and higher lows, converging toward a point. The price should be consolidating after a strong prior trend, and the trendlines should be visibly converging.Step 2: Wait for the Breakout
Symmetrical triangles can take time to form, often taking weeks or even months. As the price moves within the converging trendlines, it’s important to wait for a confirmed breakout. A breakout should be accompanied by a surge in volume, confirming that the market has made its decision and the price is set to move.Step 3: Enter the Trade
Once the price breaks above the upper trendline (bullish breakout) or below the lower trendline (bearish breakout), traders can enter the trade. The direction of the breakout will determine whether you go long or short. Enter the trade only after the breakout has been confirmed with high volume to avoid false breakouts.Step 4: Exit the Trade
The expected price movement after a breakout is often equal to the height of the triangle at its widest part. Measure the distance between the highest point of the triangle and the lowest point, and use that value to set a profit target.For a stop loss, place it just outside the opposite trendline of the breakout. For example, if entering on a bullish breakout, place the stop loss just below the lower trendline to protect against a potential reversal.
Tips for Trading Symmetrical Triangles
Wait for Confirmation
A symmetrical triangle signals a consolidation phase, but it does not indicate which direction the price will break. Always wait for confirmation of the breakout, preferably with high volume. Avoid entering too early to avoid being caught in a false breakout.Use Proper Risk Management
Because symmetrical triangles can break in either direction, risk management is essential. Set stop losses just outside the pattern to protect against a failed breakout and ensure you’re not exposed to excessive risk.The Breakout Is Key
The breakout from the symmetrical triangle is where the real action happens. Make sure the breakout is confirmed by increased volume and only enter a trade when the market has shown a clear direction.Expect Volatility After the Breakout
After the breakout, expect increased volatility as the market moves to catch up with the breakout direction. This can offer opportunities for traders to capture profits as the price continues its move.
Symmetrical Triangle Pattern FAQs
Are symmetrical triangle patterns bullish or bearish?
Symmetrical triangles are neutral and do not have an inherent directional bias. The breakout could be bullish or bearish, depending on which side the price breaks through.What is the difference between a symmetrical triangle and other triangle patterns?
Symmetrical triangles are distinct from ascending and descending triangles because they represent a consolidation period, with both the highs and lows converging. Ascending and descending triangles are directional patterns, with ascending triangles being bullish and descending triangles being bearish.Where should I set my profit target on a symmetrical triangle breakout?
To set your profit target, measure the height of the triangle at its widest part (the vertical distance between the highest high and the lowest low) and add it to the breakout point. This gives you an estimated target for where the price may move after the breakout.Where should I set my stop loss on a symmetrical triangle breakout?
Set your stop loss just outside the opposite side of the breakout. For a bullish breakout, place your stop loss just below the lower trendline. For a bearish breakout, place your stop loss just above the upper trendline. This protects you if the breakout fails and the price reverses.


Neutral Flag:
A channel flag is a continuation chart pattern that forms when an asset’s price consolidates within a parallel channel following a strong directional move. This pattern can be either bullish or bearish, depending on the preceding trend. A bullish channel flag occurs after an upward price surge, with the price consolidating in a downward-sloping or sideways channel before breaking out higher. A bearish channel flag follows a downward move, with price consolidating in an upward-sloping or sideways channel before continuing lower. The key characteristic of a channel flag is that price action remains within well-defined parallel support and resistance lines before a breakout occurs.
Understanding the Channel Flag Chart Pattern
Channel flags form as a result of temporary consolidation after a strong price movement. Traders and investors take profits, leading to a brief period of pullback or sideways movement. However, the overall trend remains intact, and once the consolidation phase ends, the price continues in the direction of the original trend. This pattern is useful for traders looking to enter positions at favorable prices before the trend resumes.
Components of a Channel Flag
Several key elements define a channel flag pattern:
Flagpole
The flagpole represents the initial strong price move leading into the formation of the channel flag. This move establishes the prevailing trend and sets the stage for the continuation pattern.Channel
The channel is formed by parallel trendlines containing the price movement. The price oscillates within this channel, creating a controlled consolidation phase. The channel can slope against the trend, remain horizontal, or in some cases, slightly slope with the trend.Breakout
The breakout occurs when the price moves decisively outside the channel in the direction of the original trend. This breakout should be accompanied by increased volume, confirming the continuation pattern.
How to Trade a Channel Flag
Traders can follow these steps to effectively trade a channel flag pattern:
Step 1: Identify the Pattern Formation
Look for a strong price movement (flagpole) followed by a period of consolidation within a well-defined parallel channel. The channel should be moving against the previous trend or sideways.Step 2: Wait for the Breakout
Since a channel flag is a continuation pattern, traders should wait for a confirmed breakout in the direction of the original trend. A strong breakout with increased volume confirms that the trend is resuming.Step 3: Enter the Trade
Traders can enter a position once the price breaks out of the channel. A common strategy is to place an entry order just beyond the channel’s boundary to capture the breakout move.Step 4: Exit the Trade
The expected price movement of a channel flag breakout is equal to the height of the flagpole added to the breakout point. This provides an estimate of the continuation target.A stop-loss order should be placed just outside the opposite boundary of the channel to protect against a failed breakout. If the price moves back into the channel, it could indicate a false breakout or extended consolidation.
Tips for Trading Channel Flags
Confirm the Channel is Well-Defined
The consolidation phase should have clearly defined parallel trendlines. A flag that lacks structure or has erratic price movement may be less reliable.Look for Strong Volume on the Breakout
A valid breakout should be accompanied by increased volume, confirming that the market has regained momentum. Weak volume on the breakout may indicate a lack of conviction and increase the risk of failure.Monitor the Flag’s Angle
Ideally, the channel flag should move slightly against the trend or remain sideways. If the flag moves too steeply in the direction of the trend, it may indicate exhaustion rather than consolidation.Use Other Indicators for Confirmation
Combining the channel flag pattern with momentum indicators such as RSI or MACD can help confirm whether the trend is likely to continue after the breakout.
Channel Flag Pattern FAQs
Are channel flags bullish or bearish?
Channel flags can be either bullish or bearish. A bullish channel flag occurs after an uptrend, while a bearish channel flag follows a downtrend. Both signal trend continuation.How is a channel flag different from a traditional flag pattern?
A traditional flag pattern is typically shorter in duration and slopes against the trend, whereas a channel flag can last longer and may have a more neutral or slightly trending consolidation phase.Where should I set my profit target on a channel flag breakout?
The profit target is typically set by adding the flagpole’s height to the breakout point. This provides an estimate of the expected price movement after the breakout.Where should I set my stop loss on a channel flag breakout?
A stop loss should be placed slightly outside the opposite boundary of the channel. This ensures protection against a failed breakout while allowing for normal price fluctuations before the trend resumes.


Bearish Pennant:
A bearish pennant is a continuation chart pattern that forms after a sharp decline in price, followed by a brief period of consolidation where the price moves in a narrowing range. The pattern resembles a small symmetrical triangle or pennant, and it typically signals that the downtrend is likely to continue once the consolidation phase is complete. During the pennant formation, the price moves within converging trendlines, with lower highs and higher lows. A breakout to the downside from this pattern suggests that the bearish momentum will resume, and the price is likely to continue falling after the consolidation phase.
Understanding the Bearish Pennant Chart Pattern
A bearish pennant begins after a significant downward price movement, known as the flagpole, followed by a period of consolidation. This consolidation takes the form of a small symmetrical triangle or narrowing range, where the price moves between higher lows and lower highs. This narrowing price action indicates indecision in the market, but the overall trend remains bearish. Eventually, the price breaks down below the lower trendline of the pennant, signaling that the downward momentum is likely to continue. Traders often look for such breakouts to enter short positions in anticipation of further price declines.
Components of a Bearish Pennant
A bearish pennant pattern consists of several key components:
Flagpole The flagpole is the steep drop in price that precedes the pennant. This sharp decline reflects the initial bearish sentiment and sets the stage for the potential continuation of the downtrend once the consolidation phase ends.
Pennant (Consolidation) The pennant itself is formed by a period of consolidation after the flagpole. During this phase, the price narrows between two converging trendlines, with lower highs and higher lows. This consolidation indicates that the market is taking a breather before the next major price movement.
Breakout A bearish breakout occurs when the price breaks below the lower trendline of the pennant. This breakout indicates that the bearish trend is likely to continue. To confirm the breakout, traders often look for higher-than-average trading volume, signaling the strength of the move.
How to Trade a Bearish Pennant
To effectively trade a bearish pennant pattern, traders can follow these steps:
Step 1: Identify the Pattern Formation To spot a bearish pennant, look for a sharp decline in price, followed by a period of consolidation that forms a small symmetrical triangle or narrowing price range. The trendlines should show lower highs and higher lows, indicating that the price is consolidating before a potential breakout.
Step 2: Wait for the Breakout The formation of a bearish pennant can take anywhere from several days to a few weeks. During this time, traders should wait for a confirmed breakout. A breakout below the lower trendline of the pennant, accompanied by increased volume, is considered a strong signal that the price is likely to continue moving lower.
Step 3: Enter the Trade Traders can enter a short position once the price breaks below the lower trendline of the pennant. A common strategy is to place an entry order just below the trendline, to ensure that the breakout is genuine and not a false move.
Step 4: Exit the Trade The expected price movement after a breakout from a bearish pennant is typically equal to the height of the flagpole, which can be added to the breakout point. Measure the flagpole’s height and subtract it from the breakout point to calculate a profit target.
A stop-loss order should be placed just above the upper trendline of the pennant. If the price moves back into the pattern or breaks above the upper trendline, it may indicate that the breakout has failed, and the trade should be exited.
Tips for Trading Bearish Pennants
Volume Confirmation A successful bearish breakout from a pennant should be accompanied by an increase in trading volume. Higher volume supports the idea that the downward momentum is strong and that the price will likely continue to decline after the breakout.
Patience and Confirmation Bearish pennants take time to form, and traders should be patient and wait for a strong breakout below the lower trendline. Entering the trade too early or jumping into a false breakout could lead to losses.
Trend Continuation Bearish pennants are continuation patterns, meaning they signal that the downtrend is likely to resume after the consolidation phase. Ensure that the price movement prior to the pennant is bearish, as the pattern is most effective when the previous trend supports continuation.
Watch for False Breakouts As with any technical pattern, false breakouts can occur. Traders should be cautious and wait for confirmation before entering a short trade. If the price breaks below the pennant but then returns to the consolidation range, it may indicate a false breakout.
Bearish Pennant Pattern FAQs
Are bearish pennants reliable? Bearish pennants are generally considered reliable continuation patterns, especially when they form after a sharp downtrend and are accompanied by an increase in volume during the breakout. However, as with any pattern, confirmation is key.
How is a bearish pennant different from a bearish flag? A bearish pennant and a bearish flag are both continuation patterns that follow a downward price movement. The key difference is that a pennant has converging trendlines forming a small symmetrical triangle, while a flag is marked by parallel trendlines with a more rectangular shape.
Where should I set my profit target on a bearish pennant breakout? The profit target for a bearish pennant breakout is typically equal to the height of the flagpole, subtracted from the breakout point. This provides an estimate of how far the price is likely to move after the breakout.
Where should I set my stop loss on a bearish pennant trade? A stop-loss order should be placed just above the upper trendline of the pennant. This allows for a small buffer in case the price retests the consolidation range, but it also protects from larger losses if the breakout fails and the price moves back up.


Bearish Rectangle:
A bearish rectangle is a continuation chart pattern that forms during a downtrend, where the price consolidates within a horizontal range, marked by clear levels of support and resistance. The pattern looks like a rectangle, with the price moving between parallel support and resistance lines. The price oscillates within this range, indicating a period of indecision before a breakout to the downside, which typically signals the continuation of the prevailing bearish trend. The bearish rectangle suggests that the market is taking a brief pause, but once the price breaks below the support level, the downtrend is likely to resume.
Understanding the Bearish Rectangle Chart Pattern
A bearish rectangle pattern usually follows a strong downward move, where the price consolidates in a narrow range. During this consolidation, the price forms a horizontal support and resistance range, with price bouncing between these levels. The pattern indicates that sellers are in control of the market, but there is a brief period of indecision, as the price moves sideways. Once the price breaks below the support line, it suggests that the selling pressure will continue, and the downtrend is likely to resume. Traders typically watch for this breakout to enter short positions and capitalize on the continuation of the downtrend.
Components of a Bearish Rectangle
A bearish rectangle pattern consists of several key components:
Flagpole (Prior Downtrend) The flagpole represents the strong downward movement before the rectangle pattern begins. It indicates the momentum of the bearish trend. The size of the flagpole can help estimate the potential breakout move after the rectangle pattern completes.
Rectangle (Consolidation) The rectangle itself is formed by two parallel trendlines, with the price bouncing between horizontal resistance and support levels. This consolidation phase represents a period of indecision where neither buyers nor sellers can fully take control. The market is in a temporary equilibrium, but the pattern suggests that the downtrend will likely continue once the consolidation phase ends.
Breakout The breakout happens when the price moves below the support level, signaling the end of the consolidation and the continuation of the bearish trend. A confirmed breakout usually comes with increased volume, which confirms the strength of the move and suggests that the downtrend will resume.
How to Trade a Bearish Rectangle
To trade a bearish rectangle pattern, traders can follow these steps:
Step 1: Identify the Pattern Formation Look for a strong downtrend followed by a consolidation phase where the price moves within a horizontal range. The price should oscillate between clear levels of support and resistance, forming a rectangular shape. The pattern should appear after a significant downward price move, indicating that the downtrend is likely to continue once the consolidation ends.
Step 2: Wait for the Breakout Bearish rectangles can take time to form, and traders should wait for a confirmed breakout below the support level. A breakout below the support level, accompanied by higher volume, is the key signal that the price will continue to move lower. False breakouts are possible, so it’s important to wait for confirmation before entering a trade.
Step 3: Enter the Trade Once the price breaks below the support level, traders can enter a short position. A common strategy is to place a sell order just below the support level to ensure that the breakout is genuine. This approach allows traders to catch the continuation of the downtrend once the price moves below the rectangle.
Step 4: Exit the Trade The profit target for a bearish rectangle breakout is generally determined by measuring the height of the rectangle, which is the distance between the support and resistance levels. Traders can subtract this distance from the breakout point to estimate the potential price movement following the breakout.
When setting a stop loss, traders should place it just above the resistance level of the rectangle. This provides some room for price fluctuations while protecting against significant losses if the breakout fails.
Tips for Trading Bearish Rectangles
Volume Confirmation A successful breakout from a bearish rectangle should be accompanied by an increase in volume. Higher volume confirms the strength of the breakout and increases the likelihood that the price will continue moving lower.
Wait for Confirmation It is essential to wait for a confirmed breakout before entering a trade. False breakouts can occur, and entering too early can result in unnecessary losses. Be sure that the breakout is genuine and supported by increased volume to reduce the risk of trading a failed breakout.
Trend Continuation Bearish rectangles are continuation patterns, meaning they are most effective when they form after a strong downtrend. The consolidation phase is a temporary pause in the bearish momentum, and the breakout below the support level signals that the downtrend is likely to resume.
False Breakouts As with any chart pattern, false breakouts can occur. Traders should watch the price closely after a breakout to ensure that the move continues in the expected direction. If the price quickly returns above the support level, it may indicate that the breakout has failed, and the pattern could be invalidated.
Bearish Rectangle Pattern FAQs
Are bearish rectangles reliable patterns? Bearish rectangles are generally considered reliable continuation patterns when they form after a strong downtrend. However, as with all patterns, confirmation is important. Traders should wait for a confirmed breakout below the support level, supported by increased volume, to improve the chances of a successful trade.
How is a bearish rectangle different from a bearish flag? A bearish rectangle is formed by horizontal support and resistance levels, with the price consolidating in a sideways range. In contrast, a bearish flag has parallel trendlines that slope upward, typically forming after a sharp downward price movement. Both patterns signal a continuation of a downtrend, but the structure and shape of the patterns are different.
Where should I set my profit target on a bearish rectangle breakout? The profit target for a bearish rectangle breakout is typically determined by measuring the height of the rectangle, which is the distance between the support and resistance levels. Subtract this distance from the breakout point to estimate the price movement after the breakout.
Where should I set my stop loss on a bearish rectangle trade? Traders should place a stop loss just above the resistance level of the rectangle. This provides room for potential price fluctuations while protecting against larger losses if the breakout fails. If the price rises above the resistance level after the breakout, it may signal that the pattern has failed and the downtrend is no longer valid.

Neutral Rectangle:
A neutral rectangle is a consolidation chart pattern that forms when the price of an asset moves sideways, bounded by two parallel trendlines that act as support and resistance. This pattern indicates indecision in the market, where neither buyers nor sellers have control, resulting in price oscillating between the horizontal support and resistance levels. Unlike continuation patterns like bullish or bearish rectangles, a neutral rectangle does not imply an immediate direction of the breakout. Instead, it signals that the market is in a temporary pause, and a breakout could occur in either direction. The breakout's direction will depend on the prevailing market sentiment and the volume supporting the move.
Understanding the Neutral Rectangle Chart Pattern
The neutral rectangle pattern typically forms after a period of strong directional movement—either upward or downward. However, once the price reaches a certain level, the momentum slows, and the price begins to consolidate within a defined range. The price moves between horizontal levels of support and resistance, creating a rectangular shape on the chart. This period of consolidation suggests that the market is waiting for new information or a catalyst to drive the next significant move. The breakout from the neutral rectangle pattern can occur in either direction, depending on the market dynamics at the time.
Components of a Neutral Rectangle
A neutral rectangle pattern is made up of several essential components:
Preceding Trend (Initial Price Movement) Before the rectangle pattern forms, there is usually a strong move, either up or down, indicating that the market is in a directional phase. The neutral rectangle forms after this initial price movement, signaling that the market has entered a consolidation phase.
Support and Resistance Levels The neutral rectangle is bounded by two parallel horizontal lines. The support level represents the lower boundary, where the price tends to bounce upwards, while the resistance level represents the upper boundary, where the price faces selling pressure. The price oscillates between these levels, creating a rectangle on the chart.
Consolidation The consolidation phase occurs as the price moves sideways within the rectangle, indicating that market participants are uncertain about the next direction. During this phase, buyers and sellers are in equilibrium, with no decisive push in either direction.
Breakout The breakout from a neutral rectangle happens when the price moves beyond the support or resistance level, signaling the end of the consolidation and the start of a new directional move. This breakout could be either to the upside or downside, depending on which side of the rectangle is breached.
How to Trade a Neutral Rectangle
To trade a neutral rectangle pattern, traders can follow these steps:
Step 1: Identify the Pattern Formation The first step is to identify the neutral rectangle on the chart. Look for a consolidation phase following a strong price movement. The price should be moving between two parallel, horizontal lines of support and resistance. The longer the consolidation phase, the more significant the eventual breakout is likely to be.
Step 2: Wait for the Breakout Since the neutral rectangle does not indicate a clear direction, traders should wait for the breakout before taking a position. The breakout occurs when the price moves beyond either the support or resistance level. A breakout above the resistance line indicates potential upward momentum, while a breakout below the support line suggests continued downward pressure.
Step 3: Enter the Trade Once the price breaks out of the neutral rectangle, traders can enter a position in the direction of the breakout. If the breakout is to the upside, traders can go long, while if the breakout is to the downside, they can enter short positions. It’s essential to wait for confirmation of the breakout to avoid false moves.
Step 4: Exit the Trade The target for a neutral rectangle breakout is typically estimated by measuring the height of the rectangle. This is the distance between the support and resistance levels. After a breakout, traders can project this distance from the breakout point to estimate where the price might move. Setting a stop loss just inside the rectangle, either just above the resistance or below the support, helps manage risk.
Tips for Trading Neutral Rectangles
Volume Confirmation A valid breakout from a neutral rectangle should be accompanied by an increase in trading volume. Higher volume signals the commitment of traders to the breakout direction, confirming the strength of the move. A breakout on low volume may indicate a false move and could lead to a price reversal.
Watch for False Breakouts Neutral rectangles often lead to false breakouts, where the price briefly moves beyond the support or resistance level but then reverses back into the rectangle. It’s essential to wait for confirmation of the breakout with higher volume before entering the trade. False breakouts can lead to losses if entered too early.
Market Sentiment The direction of the breakout from a neutral rectangle often depends on the prevailing market sentiment. If the market has been in an uptrend before the rectangle formed, a breakout to the upside may be more likely. Conversely, if the market has been in a downtrend, the breakout could lean toward the downside. However, there’s no guarantee, and the breakout could go in either direction.
Use of Other Indicators It’s helpful to use other technical indicators in conjunction with the neutral rectangle pattern. For instance, oscillators like the RSI (Relative Strength Index) or MACD (Moving Average Convergence Divergence) can provide additional confirmation of the breakout's strength or overbought/oversold conditions before entering a trade.
Neutral Rectangle Pattern FAQs
Is a neutral rectangle a bullish or bearish pattern? A neutral rectangle is neither inherently bullish nor bearish. It is a consolidation pattern that can break out in either direction. The breakout direction depends on the broader market sentiment or new information that moves the market.
How long does a neutral rectangle pattern take to form? A neutral rectangle can take from a few days to several weeks to form, depending on the asset's volatility and the time taken for market participants to reach a consensus. A longer consolidation phase generally indicates a stronger breakout when it eventually occurs.
How can I calculate the profit target for a neutral rectangle breakout? To calculate the profit target, measure the height of the rectangle by calculating the distance between the support and resistance levels. Once the breakout occurs, project this distance from the breakout point to estimate where the price might move. This gives an approximate target for the trade.
Where should I place my stop loss for a neutral rectangle breakout? The stop loss should be placed just inside the rectangle, either above the resistance level (if going short) or below the support level (if going long). This ensures that you limit your losses if the breakout turns out to be a false move and the price reverses back into the rectangle.


Bearish Flag:
A bearish flag is a continuation chart pattern that forms after a strong downward price movement, followed by a period of consolidation in a small, upward-sloping channel. This pattern signals that the prevailing downtrend is likely to resume once the consolidation phase is complete. The key characteristic of a bearish flag is the formation of parallel support and resistance lines that slope against the primary trend before price breaks downward, continuing the decline.
Understanding the Bearish Flag Chart Pattern
Bearish flags form as a result of temporary consolidation after a sharp price drop. This consolidation occurs as traders take profits or as the market experiences a short-term pullback before continuing downward. The pattern indicates that selling pressure remains dominant and that the price is likely to break lower once the consolidation phase concludes. Bearish flags are commonly seen in strong downtrends and provide traders with opportunities to enter short positions in anticipation of further declines.
Components of a Bearish Flag
Several key elements define a bearish flag pattern:
Flagpole
The flagpole represents the initial strong downward move that precedes the flag’s formation. This sharp decline establishes the prevailing bearish trend.Flag
The flag itself is a small, upward-sloping or sideways channel that forms after the initial decline. Price moves within this channel in a controlled manner before breaking downward.Breakout
A breakout occurs when the price decisively moves below the lower boundary of the flag, signaling a continuation of the downtrend. This breakout should be confirmed by increased trading volume.
How to Trade a Bearish Flag
Traders can follow these steps to effectively trade a bearish flag pattern:
Step 1: Identify the Pattern Formation
Look for a strong downward price movement (flagpole) followed by a brief period of consolidation in an upward-sloping or sideways channel.Step 2: Wait for the Breakout
Since a bearish flag is a continuation pattern, traders should wait for a confirmed breakdown below the lower boundary of the flag. A strong breakdown with increased volume confirms that the trend is resuming.Step 3: Enter the Trade
Traders can enter a short position once the price breaks below the flag’s lower boundary. A common strategy is to place an entry order just below the flag’s support line to capture the breakdown move.Step 4: Exit the Trade
The expected price movement of a bearish flag breakout is equal to the height of the flagpole subtracted from the breakout point. This provides an estimate of the continuation target.A stop-loss order should be placed just above the upper boundary of the flag to protect against a failed breakdown. If the price moves back inside the flag, it could indicate a false breakout or extended consolidation.
Tips for Trading Bearish Flags
Confirm the Flag’s Structure
The consolidation phase should form a well-defined upward-sloping or sideways channel. If price movement appears erratic or lacks structure, the pattern may be unreliable.Watch for High Volume on the Breakdown
A valid breakdown should be accompanied by increased volume, confirming strong selling pressure. Weak volume on the breakdown may indicate a lack of conviction and increase the risk of failure.Monitor the Flag’s Angle
The flag should slope slightly upward or move sideways. If the consolidation moves too steeply upward, it may indicate trend exhaustion rather than continuation.Use Additional Indicators for Confirmation
Momentum indicators such as RSI or MACD can help confirm whether the trend is likely to continue after the breakdown.
Bearish Flag Pattern FAQs
Are bearish flag patterns reliable?
Bearish flags are considered highly reliable continuation patterns, especially in strong downtrends. However, confirmation through volume and other indicators is essential.How is a bearish flag different from a descending triangle?
A bearish flag forms after a sharp decline and consists of a temporary upward-sloping or sideways consolidation, whereas a descending triangle has a horizontal support line with lower highs. Both signal potential bearish breakouts, but they have different structures.Where should I set my profit target on a bearish flag breakdown?
The profit target is typically set by measuring the height of the flagpole and subtracting it from the breakout point. This provides an estimate of the expected price movement after the breakdown.Where should I set my stop loss on a bearish flag trade?
A stop-loss order should be placed slightly above the upper boundary of the flag to protect against a failed breakdown while allowing for minor price fluctuations before the trend resumes.

Pennants
Pennant patterns occur during periods of consolidation after a strong price movement, where the market pauses to catch its breath before continuing in the same direction. There are two types of pennants:
Bullish Pennant:
A bullish pennant is a continuation chart pattern that forms after a strong upward price movement, followed by a period of consolidation where price moves in a narrow, converging range. The pennant pattern resembles a small symmetrical triangle or flag, with the price consolidating between two converging trendlines before breaking out in the direction of the previous uptrend. This pattern signals that the price is likely to continue rising after the consolidation phase is complete, as the bulls remain in control and prepare for the next leg up.
Understanding the Bullish Pennant Chart Pattern
A bullish pennant forms when a stock experiences a sharp upward movement, also known as the flagpole, followed by a period of consolidation in a converging price range. During this consolidation, the market’s buying momentum slows down, but the overall trend remains bullish. The price action starts to form higher lows and lower highs, creating a narrowing price range. Eventually, when the consolidation is complete, the price breaks out above the upper trendline of the pennant, signaling a continuation of the previous uptrend. Traders typically look for this breakout to enter long positions in anticipation of further upward movement.
Components of a Bullish Pennant
Several key components define a bullish pennant pattern:
Flagpole The flagpole is the sharp upward movement that precedes the pennant’s formation. This price spike establishes the overall bullish sentiment and provides the momentum that the market needs for the next phase of the uptrend.
Pennant (Consolidation) The pennant itself is formed by the price consolidating in a narrow range between converging trendlines. These trendlines represent the support and resistance levels that form during the consolidation phase. The pattern typically lasts from a few days to several weeks.
Breakout A bullish breakout occurs when the price breaks above the upper trendline of the pennant, signaling that the previous upward momentum is likely to continue. This breakout should be accompanied by increased volume, confirming the strength of the move.
How to Trade a Bullish Pennant
Traders can follow these steps to effectively trade a bullish pennant pattern:
Step 1: Identify the Pattern Formation Look for a strong upward price movement, followed by a period of consolidation in the form of a symmetrical triangle or small range. The price should make higher lows and lower highs as it forms the pennant shape.
Step 2: Wait for the Breakout Pennant patterns can take several days or weeks to form. During this time, it’s important to wait for a confirmed breakout. A breakout above the upper trendline of the pennant, accompanied by higher volume, is considered a strong signal for continuation.
Step 3: Enter the Trade Traders can enter a long position once the price breaks above the upper trendline of the pennant. A common strategy is to place an entry order just above the trendline to catch the breakout.
Step 4: Exit the Trade The expected price movement after a breakout from a bullish pennant is generally equal to the height of the flagpole added to the breakout point. Measure the height of the flagpole and use this as a target for your trade’s profit potential.
A stop-loss order should be placed just below the lower trendline of the pennant. If the price moves back into the pattern or breaks below the pennant, the breakout may have failed, and the trade should be exited.
Tips for Trading Bullish Pennants
Volume Confirmation A successful breakout from a bullish pennant pattern should be accompanied by an increase in trading volume. Higher volume signals that there is strong buying interest and supports the idea that the uptrend will continue.
Patience Is Key The formation of a bullish pennant can take time, and not every breakout results in sustained upward movement. Traders should be patient and wait for the breakout to be confirmed by volume and price action.
Trend Continuation Bullish pennants are continuation patterns, meaning that the price is likely to resume its previous uptrend after the consolidation. Ensure that the trend preceding the pennant is bullish, as the pattern is only effective when the prior trend supports continuation.
Watch for False Breakouts While bullish pennants are typically reliable patterns, false breakouts can occur. Always wait for a strong breakout above the pennant’s upper trendline and avoid jumping into a trade too early.
Bullish Pennant Pattern FAQs
Are bullish pennants reliable? Bullish pennants are considered reliable continuation patterns when they form after a strong uptrend and are accompanied by an increase in volume during the breakout. However, it’s essential to wait for confirmation before entering the trade.
How is a bullish pennant different from a bullish flag? A bullish pennant and a bullish flag are both continuation patterns that form after a sharp price movement. The key difference is that a pennant has converging trendlines, forming a triangle shape, while a flag consists of parallel trendlines with the price moving in a small upward or sideways channel.
Where should I set my profit target on a bullish pennant breakout? The profit target is typically equal to the height of the flagpole added to the breakout point. This provides an estimate of how far the price is likely to move after the breakout.
Where should I set my stop loss on a bullish pennant trade? A stop-loss order should be placed just below the lower trendline of the pennant, allowing for some wiggle room in case the price retests the consolidation range. If the price falls below the pennant, it may signal that the breakout has failed.
Rectangle Patterns
Rectangle patterns occur when the price of an asset moves within a well-defined range, typically between a resistance and support level, over a period of time. There are three types of rectangles:
Bullish Rectangle:
A bullish rectangle is a continuation chart pattern that forms during an uptrend, where the price moves within a horizontal range, marked by a clear level of support and resistance. The pattern looks like a rectangle, with parallel trendlines forming the top (resistance) and bottom (support) of the range. The price oscillates between these two levels, indicating a consolidation phase before the price breaks out to the upside, continuing the prevailing uptrend. The bullish rectangle suggests that the market is gathering momentum, and once the price breaks above the resistance level, the uptrend is likely to resume.
Understanding the Bullish Rectangle Chart Pattern
A bullish rectangle forms after a strong price move upward, followed by a period of consolidation. During this consolidation, the price moves between a horizontal support and resistance level, creating a rectangular shape on the chart. This period of indecision signals that both buyers and sellers are in a state of equilibrium, but the overall trend remains bullish. The breakout above the resistance line indicates that the buyers have regained control, and the price is likely to continue higher. Traders watch for this breakout to enter long positions and ride the continuation of the uptrend.
Components of a Bullish Rectangle
A bullish rectangle pattern consists of several key components:
Flagpole (Prior Uptrend) The flagpole is the initial price move upward that precedes the rectangle pattern. It represents the strong bullish momentum that the market was experiencing before entering the consolidation phase. The size of the flagpole gives an indication of the potential breakout move once the pattern is complete.
Rectangle (Consolidation) The rectangle itself is formed by two parallel trendlines, with the price oscillating between a level of resistance at the top and a level of support at the bottom. This consolidation phase indicates that the market is taking a pause, with no clear direction. However, the consolidation occurs within the context of an existing uptrend, suggesting that the bullish momentum will likely resume once the consolidation ends.
Breakout The breakout occurs when the price moves above the resistance level, signaling the end of the consolidation phase and the continuation of the uptrend. Traders look for an increase in volume to confirm the breakout, as higher volume indicates the strength of the move and increases the likelihood of the price continuing to rise.
How to Trade a Bullish Rectangle
To trade a bullish rectangle pattern, traders can follow these steps:
Step 1: Identify the Pattern Formation To identify a bullish rectangle, look for a strong uptrend followed by a period of consolidation, where the price moves between two horizontal levels of support and resistance. The rectangle pattern should have parallel trendlines, with the price oscillating between the support and resistance levels.
Step 2: Wait for the Breakout The bullish rectangle pattern can take days or weeks to form, and traders should wait for a confirmed breakout above the resistance level. A breakout above this resistance, accompanied by an increase in volume, is the key signal that the uptrend is likely to resume. False breakouts can occur, so it is important to wait for confirmation before entering a trade.
Step 3: Enter the Trade Once the breakout occurs, traders can enter a long position. A common strategy is to place a buy order just above the resistance level to ensure that the breakout is genuine. This approach allows traders to catch the continuation of the uptrend once the price moves above the rectangular pattern.
Step 4: Exit the Trade The profit target for a bullish rectangle breakout is generally determined by measuring the height of the rectangle (the distance between the support and resistance levels) and adding that distance to the breakout point. This gives an estimate of the potential price movement after the breakout.
When setting a stop loss, traders should place it slightly below the support level of the rectangle. This provides some room for price fluctuations while protecting against significant losses in case the breakout fails.
Tips for Trading Bullish Rectangles
Volume Confirmation A successful breakout from a bullish rectangle should be accompanied by an increase in trading volume. Higher volume confirms the strength of the breakout and increases the likelihood that the price will continue to rise after the breakout.
Be Patient and Wait for Confirmation Bullish rectangles can take time to form, and traders should avoid entering a position too early. It is better to wait for a confirmed breakout, especially with an increase in volume, to reduce the risk of entering on a false breakout.
Trend Continuation Bullish rectangles are continuation patterns, so they are most effective when they form after a strong uptrend. The consolidation period simply represents a pause in the bullish momentum, and the breakout above the resistance level suggests that the uptrend will resume.
False Breakouts As with any technical pattern, false breakouts can occur, so it is important to monitor the price action closely. If the price breaks above the resistance level but quickly falls back into the rectangle range, this could indicate a failed breakout.
Bullish Rectangle Pattern FAQs
Are bullish rectangles reliable patterns? Bullish rectangles are generally considered reliable continuation patterns when they occur after a strong uptrend. However, as with all patterns, confirmation is important, and traders should watch for a breakout above the resistance level accompanied by increased volume to increase the chances of a successful trade.
How is a bullish rectangle different from a bullish flag? A bullish rectangle is characterized by horizontal support and resistance levels, with the price moving sideways. In contrast, a bullish flag has parallel trendlines that slope downward, typically forming after a sharp price increase. Both patterns indicate continuation of an uptrend, but the shape and structure of the patterns are different.
Where should I set my profit target on a bullish rectangle breakout? The profit target for a bullish rectangle breakout is typically equal to the height of the rectangle, measured from the support level to the resistance level. Adding this distance to the breakout point gives an estimate of the price movement following the breakout.
Where should I set my stop loss on a bullish rectangle trade? Traders should place a stop loss just below the support level of the rectangle to protect against a false breakout. If the price falls below the support level, it may indicate that the breakout has failed and the price could reverse. A tight stop loss helps limit potential losses in such cases.


