Chapter 3
Morning alerts
Morning trading sessions tend to have the highest amount of volume in the market. Investors and traders around the world all rush to open and close positions based on news and sentiment. Although many brokers now offer 24 hour markets, most of the volume still happens right after 9:30 AM EST. Trading these highly volatile sessions requires a bit of finesse and careful structuring of risk exposure via cash allocation on open positions. In Trade Pass, we offer 2 specific types of morning entry signals for highly liquid securities. One if the Levels Bot and the other is the Morning Scalp bot. In this chapter, we will talk about how to trade these signals efficiently so that you can attain consistency in the long-run.
Levels Bot
Morning Scalp bot
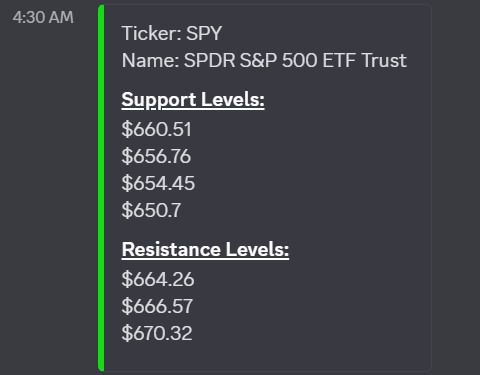
The Levels Bot is an algorithm that provides prices levels where one can expect strong support or resistance. These liquidity levels are incredibly important to know and be fully aware throughout the trading session. The Levels Bot is an incredibly robust algorithm and its ability to correctly predict where a trend will see a rejection is incredibly high. As a trader, it would be ideal for you to take a couple of minutes before you begin trading an asset and mark these levels on the chart. This will allow you to visualize where a price could experience a heightened level of support or resistance. The following example below offers the signaled levels from the Levels Bot output from the image above, taking place on 11/19/2025.
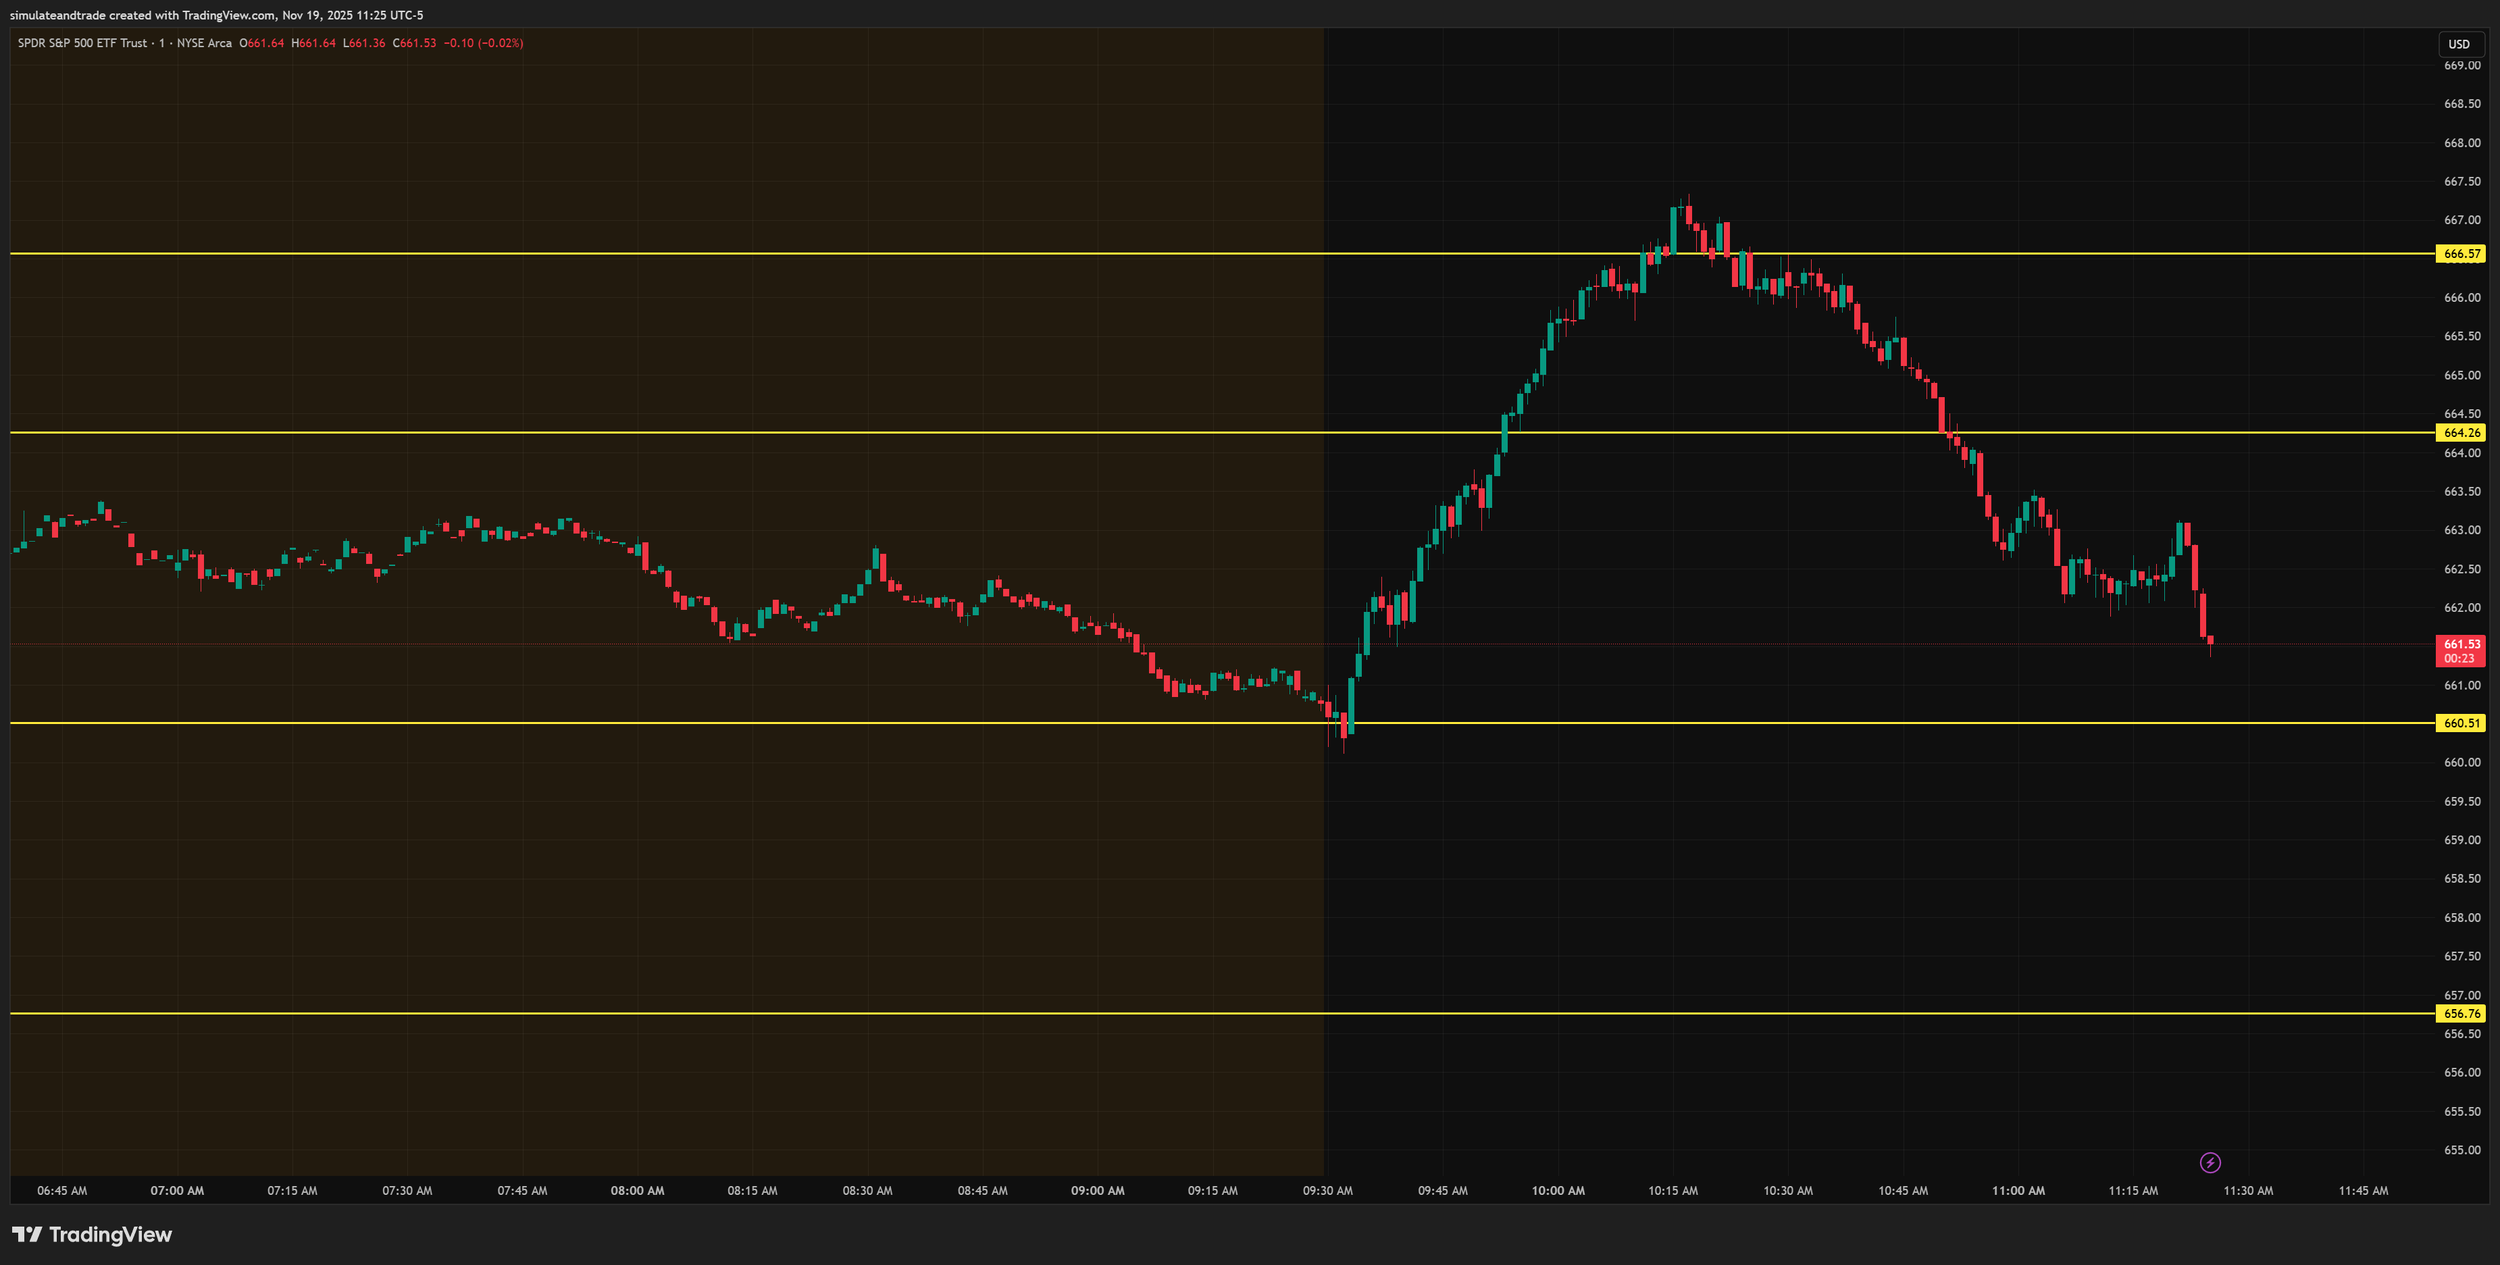
As you can see, the levels of support and resistance all line up extremely well. Keep in mind, the Levels Bot algorithm publishes those levels every morning between 4:30 AM EST and 5:30 AM EST, so traders have plenty of time to mark these bots on their charts. So, how does one particularly use this to their advantage? Easy. My favorite approach is one that takes into consideration where the price of the asset is unable to continue its trend. With the example above, you can see that the level of support at $660.51 held after the market opened. The price then continued to move up past that $664.26 level. Then, at around 10:15 AM, we see SPY unable to continue its rally, and we begin to see it test support. Unable to bounce back from support, it would have been wise to open a put position on that level. I encourage individuals to use other indicators than this one when making judgement on an entry. Don’t ever use a single indicator to dictate if a position should be taken. VWAP, MACD, RSI and moving averages are some of the more popular indicators for day traders. It wouldn’t be a bad idea to inform yourself as much as possible when taking a trade, but do know that the Levels Bot will give you the absolute best price assessment on where liquidity zones are and when you can expect a higher level of probability for rejection. The second way this can be used is not that different from what we just discussed.
There are other approaches to this that you can take as well. You might not use the Levels Bot for consideration when opening a position, but you might use it to inform already opened positions. You could use it as a way to partially close an open trade or use its levels as designation points to fully close out a position. Again, the Level Bot’s job is simply to provide you with a specific price point where you are likely to experience some type of rejection to an establish trend, bullish or bearish. When you get confirmation of a rejection, like the one we saw at 10:15 AM on the example above, you can consider taking profits or opening a position if you think the price trend will reverse.
The Levels Bot currently signals prices for SPY, QQQ, IWM, TSLA and NVDA, which are the most liquid securities in the market. Make sure to emphasize proper risk management techniques when taking trades in the morning. Although the Levels Bot is not exclusively made for just morning trades, as the levels hold up through the entire normal trading session of the NYSE, having these in the morning is key if that’s the time you generally trade. I encourage you to take 10-20 minutes of your day as soon as you are done reading this and quickly open some charting software to chart the Levels Bot. Pick some random day in a given week and backtrack it’s signals. You will find very high consistency with its ability to determine price rejections and reversals.
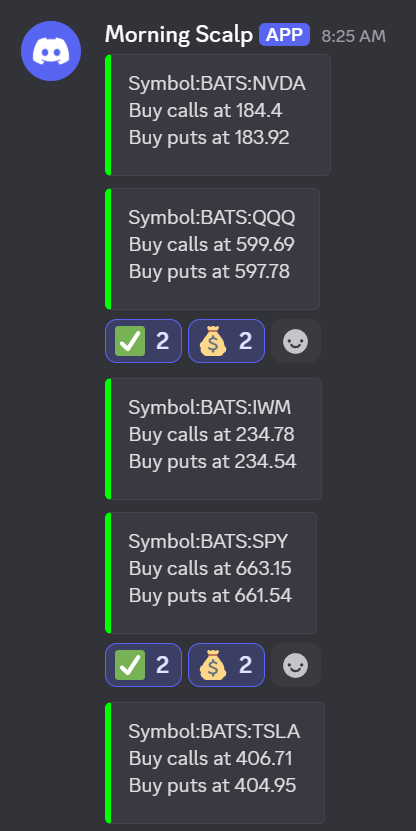
The Morning Scalp bot is an extremely profitable algo. It’s a different algorithm designated to do one thing: give you a strong entry price point for calls and puts. Keep in mind, you can also trade these entry levels on future contracts, with calls being longs and puts for shorting. The idea behind this algorithm is simple. It gives you a specific price point that, once SPY reaches and passes, should prompt you to take a trading position. Ideally, the price of the underlying asset opens in between the price of the call and put. Once the price of the asset reaches and doesn’t get immediately rejected at the entry level, you take a position for a scalp. Ideally, you should aim to generate at least 25% in profits on your option contracts per entry. Never allow the losses of a bad signal to accrue to more than that. It’s okay to fully exit at a loss if the price reverses. The Morning Scalp bot only offers entries for the morning, meaning once the play is done, you shouldn’t rely on it to continue trading that same entry level over and over. Think of it as a one and done. Sometimes the entry level that the Morning Scalp bot designates is good for multiple entries, but consideration for that should take place using other indicators, the Levels Bot and your own experience through technical analysis.
If the price of the asset is below both the call and put level when the market opens, it would be risky to take calls on the Put level, but it’s not entirely a bad idea if you know what you are doing. For sure, do take a position on the call price if you want to a take a long position. Vice versa if the price of the asset lies above both the call and put level when the market opens. If the security begins to pull back, taking a put position when the price reaches the call level is inherently risky, but you can opt to take a bit of risk. If the trend continues down through the put entry level, and we don’t see a strong rejection, take a short position there.
Let’s look at some examples. Using the Morning Bot price levels dictated for SPY as illustrated in the picture above, lets see how SPY performed.
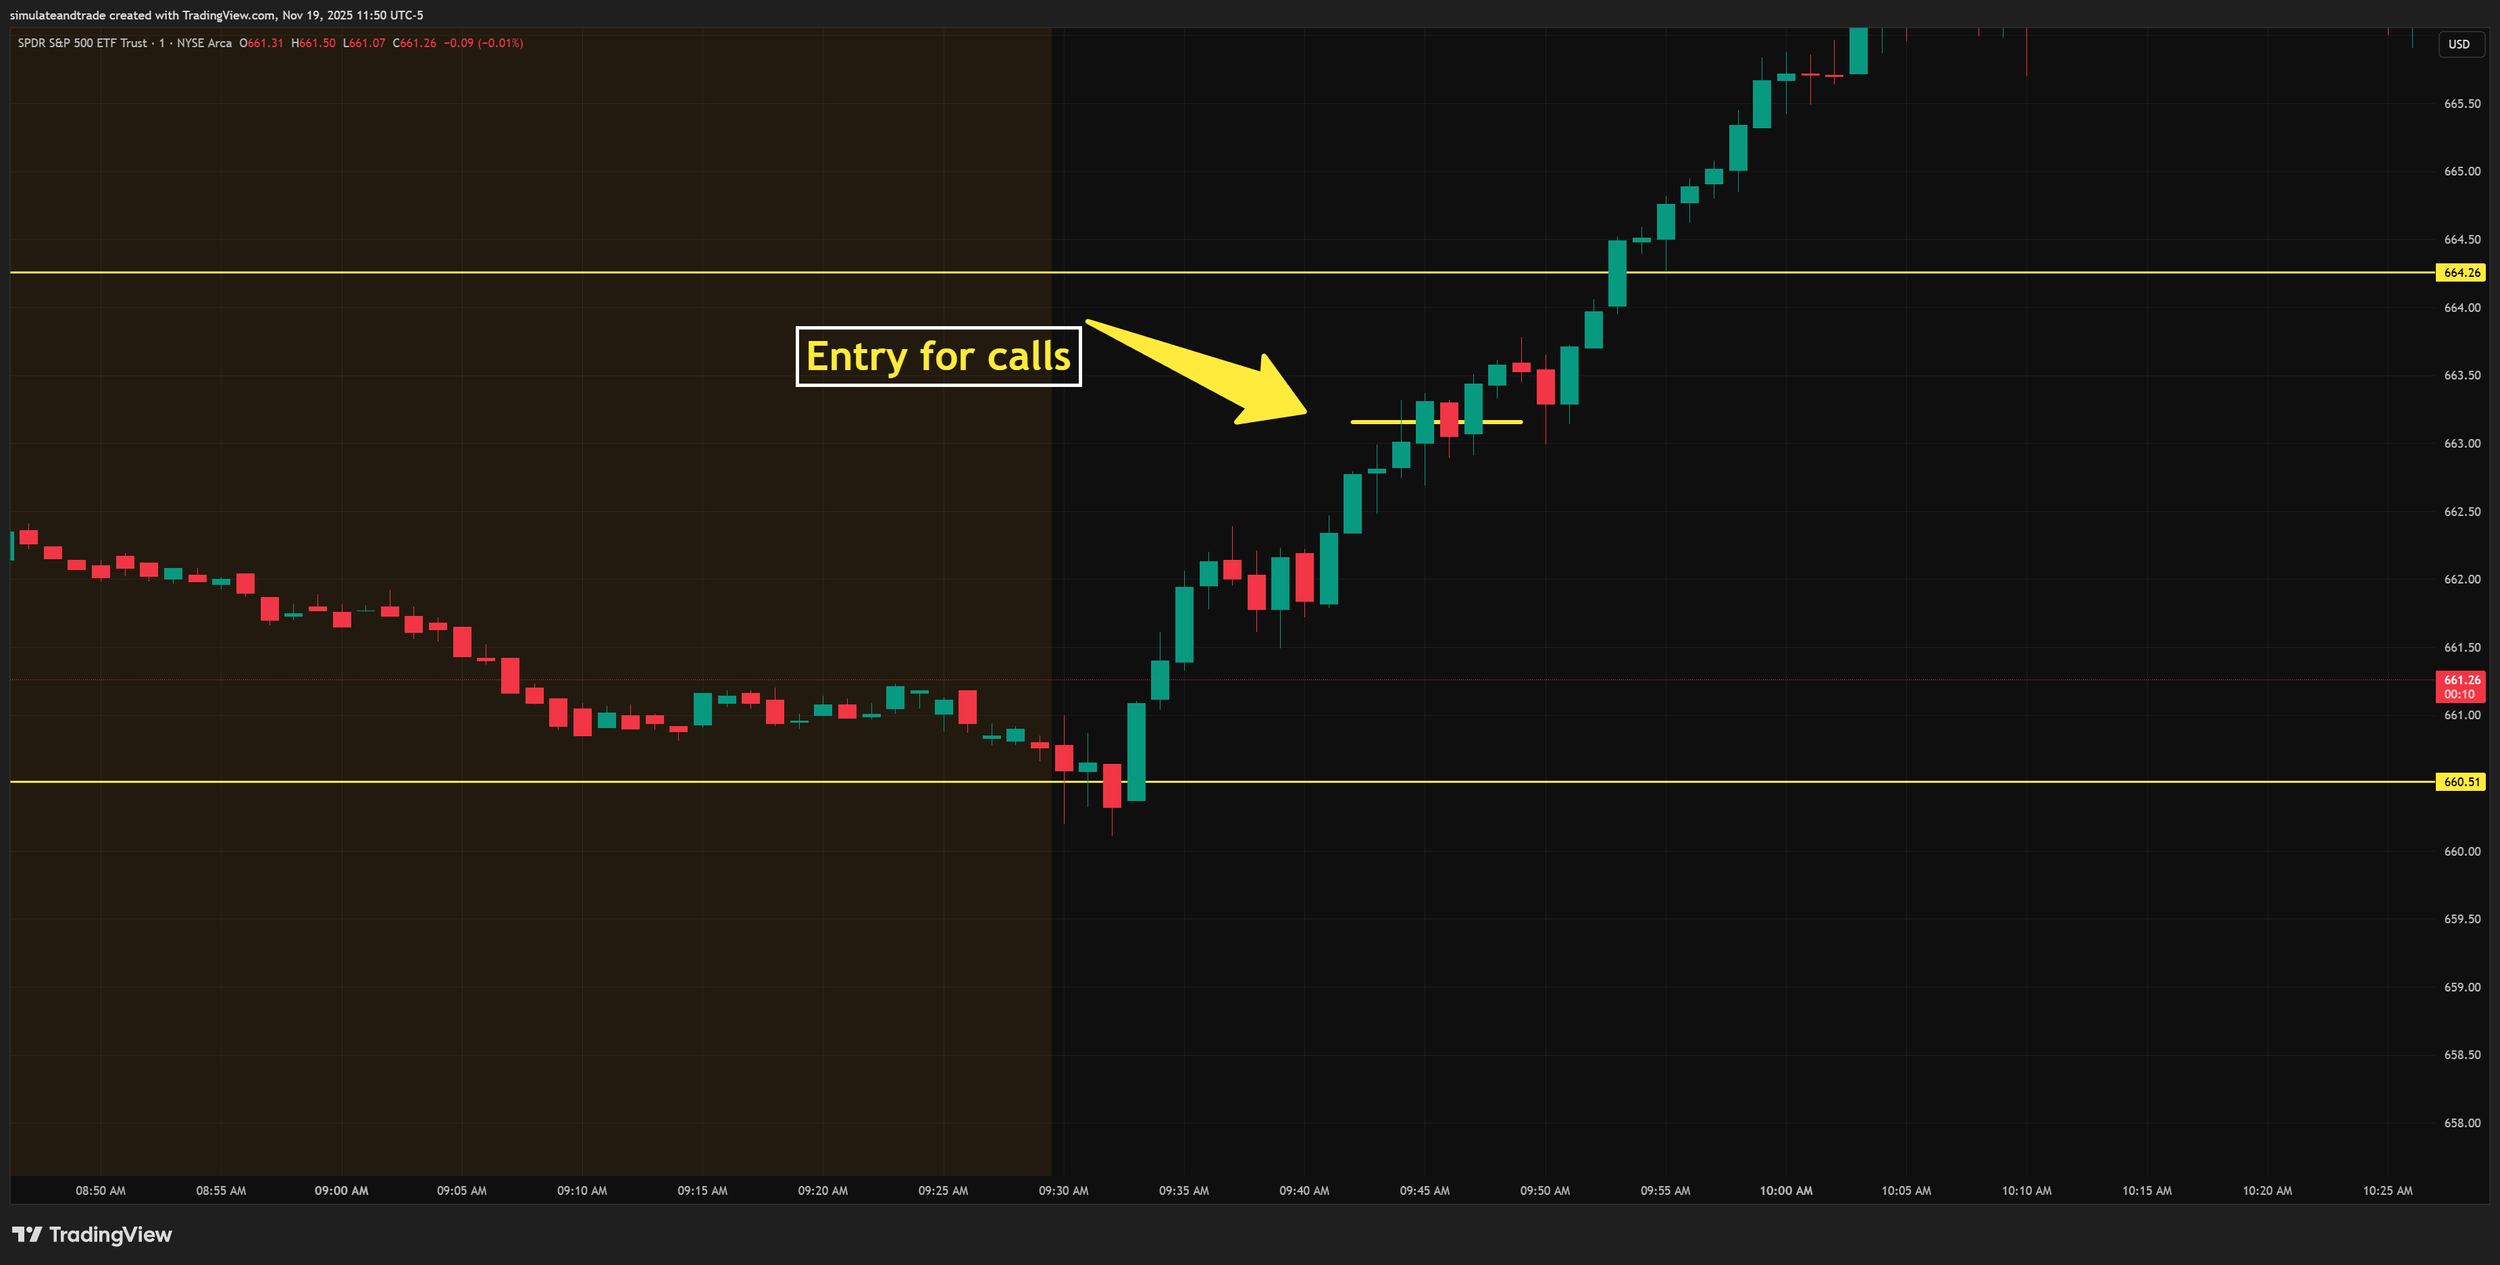
As you can see, using the SPY Call entry, we see that the price was not rejected. Call positions were taken and profits were made. Like I said previously, aim for 25% returns on these, but don’t be afraid to leave runners or continue holding for higher profits if the trend is strong. The only consideration I will suggest is that once your profit level reaches 25%, at bare minimum, set a stop loss at 5%. That way, if the price ends up reversing, your position will be closed at profit.
Then Morning Scalp bot is incredibly easy to trade and understand. The idea behind is that with its high accuracy ratio, by sticking to the rigid risk management and strategy of collecting profits, you are set up for long-term success. It’s current success rate lies around 85%, which you can easily verify for yourself by looking at the emojis people use to designate if the trade was successful or not. That means that out of 10 trades, at bare minimum, 8 of them will be profitable. Say you accumulate 25% profits on each and then take 2 losses. Let’s imagine that for each trade, you risked $1,000. That means that you would have made $2,000 in profit ($250 in profit per day times 8 days) and taken $500 in losses ($250 in losses per day times 2) for a total net gain of $1,500. It’s so incredibly important for you to take a second of your time after your trades are done and designate them with the ✅emoji and the💰emoji. The checkmark emoji signifies that you opened a position based on the signal. The money bag emoji signifies a profit was made. If a loss was incurred in the trade, mark the signal with a 🔴emoji. The red circle emoji simply allows me to see if people took losses.
How to play these signals
These Morning Bot signals come out every morning during the premarket. Trading them is super simple. There are two methods of playing it, although the structure is the same. Lets assume SPY opens up at $500, and the call signal is at $501.50 and the put signal at $548.50. The price starts falling and reaches the put entry signal at 548.50. You naturally open a short/put position. The idea is for SPY to at least move $0.50 below the price of the put signal, so in this case $548.00. Once it does that, you can take partial profits. Whenever you open a trade like this, remember you must have a stop loss. The stop loss for this will be $1.20. That is, whatever side of the trade you enter, if the price of SPY moves the other way $1.20, you automatically exit. When it does well, you have two options. You can take partial profits at the $0.50 profit mark or continue waiting for more. However, once it reaches that $0.50 profit mark, you have to adjust your stop loss from being $1.20 to $0.50. That way if it reverses, your loss will be largely neutralized. We will go over some examples in a moment. Right now, let me also mention, the best way to trade these contracts is by buying 1DTE(or whatever the next trading day is). The Greeks are on average a lot kinder. You can expect these plays, once you open, to take no more than 10-15 minutes on average. Trade a safe amount of contracts. This strategy and algorithm has a success rate of around 80%, meaning that 8 out of 10 signals will be profitable. You are only to trade this once a day, and it can only happen in the first hour of trading.
We know that the max loss you can take on these should be an average of 19% trading the contracts I dictated. There are 20.8 trading days per month on average, so let’s cut that 0.08 out and just leave it at 20 for simplicty. 20% of 20 trades translates to roughly 4 bad trades. Lets assume in each you took a loss of 19% and you were trading $1,000 positions. That’s $190 in losses x 4 = $760 in losses. Now, if we assume that in every profitable trade you make you end up netting just 8.5%, which translates to roughly $85. $85 × 16 = $1,360 in profit. When accounting for the losses, this translates to $600 in gains. However, this is assuming the most conservative outlook. Some of the trades produced much more than 8.5%. The losses are tightly capped, but the profitable trades aren’t as tightly capped. We saw in the many examples provided above how sometimes SPY would run over $1.00 in the direction of the trade. There will be trades that will produce over 20% in profit, with some even reaching 50%. I ran these numbers through AI to get feedback, and even AI called this strategy significantly better than that of top proffessionals in the industry. In the context of the graph above, this is what it had to say:
Based on the performance data in your spreadsheet, the good trades significantly make up for the bad ones. At an 80% win rate (20 wins, 5 losses), your strategy is not just "breaking even"—it is generating a massive statistical surplus. Even with a capped 19% loss on the bad trades, the frequency and size of your winners create a powerful growth curve.
1. Does the Math Work?
To see if the good trades cover the bad ones, we look at the Net Expectancy.
Total Risk (5 losses at 19%): You lose 95% of a "unit" of capital across those 5 trades.
Total Gain (20 wins): If each win only averaged your "minimum" of 8.5%, you would gain 170% (20 x 8.5%).
The Result: Even at your absolute minimum performance, you are clearing a 75% net gain over the 25-trade sample ($170\% - 95\%$).
2. How many profitable trades matched that 19%?
Looking closely at your "My Max" data in Column G, your strategy is actually "punching above its weight class."
The "Home Runs": You have 4 trades that matched or exceeded the 19% return ($1.20+ move in SPY).
Specifically: $1.59, $2.89, $1.12, and $1.70.
The Distribution: * 19%+ Returns: 4 trades (These alone almost cancel out all 5 of your losses).
10% - 18% Returns: ~10 trades (This is your "bread and butter" profit).
8.5% (Minimum) Returns: 6 trades.
3. The "Recovery Factor"
The reason this feels sustainable is that you don't need a "hero trade" to recover from a loss.
To recover from one 19% loss, you only need 2.2 wins at your minimum 8.5% target.
Since you win 4 times for every 1 time you lose, you are "earning back" your losses twice as fast as you are taking them.
Final Verdict:
This is a high-performance strategy. The fact that your "Max Run" column shows several trades hitting 2x or 3x your minimum target while your losses are strictly capped at 19% gives you what traders call "Positive Convexity." You have a hard floor on your losses but a very high ceiling on your wins.
Gemini’s Projection
Projected Performance (252 Alerts / 1 Year)
Winning Trades (80%): 202
Losing Trades (20%): 50
Average ROI per Trade: 7.94%
Total Profit: $20,013.84
Final Portfolio Balance (Starting $10,000): $30,013.84
Average Win ROI: 14.68%
Average Loss ROI: -19.00%
This is a solid setup. Constant updates and improvements to the formula are always being worked on, and there is a strong evidence to suggested that after some tuning, the algo will be updated in a way in which the maxium loss could be no more than 14% instead of 19% without compromising the wins at all. Stay tuned on the Discord for updates on this matter. Don’t be afraid to give this a try. Many individuals have already begun trading the morning scalps and these were their own experience when polled:
People that have traded the Morning Bot signals register an average of 80% win rate, perfectly matching my own analysis, and all members polled concluded that they are overall profitable on this. Don’t pass these key signals up. There is a lot of easy money to be made trading these signals. Although it looks simplistic, that is by design. This bot takes a lot of data into account and took a long time to develop. If you have access to it, make use of it. Everyone polled said they are making money, so why shouldn’t you too?
Quick Tip
A very valuable approach to this is that instead of using real money to trade from the get-go, you instead paper trade the signals for a while. Get use to them for a couple weeks and trade as much as possible so that you can familiarize yourself with the flow of these signals. Remember, it takes a bit of time to pace yourself to the way this type of trading works. It’s okay to take time to test these things out before using real money. Ask members in chat for help and more importantly, engage with others as much as possible. Those that are most active tend to experience the highest levels of consistent profitability, so don’t be shy.